
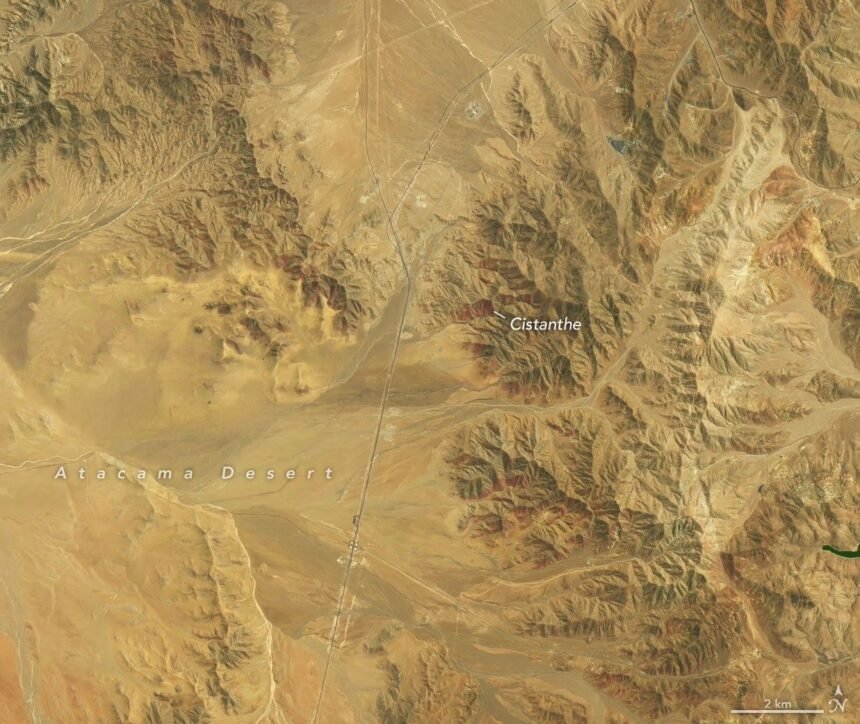
Hills southwest of Copiapó in northern Chile changed colour between two satellite passes in September and October 2026. In the first view, the ground is largely brown with scattered green patches. In the second, purple-red streaks run across several slopes near the eastern part of Desierto Florido National Park. NASA Earth Observatory published the comparison on 19 November and described a flowering season that researchers suspect may rank among the most extensive they have observed from space.
The two pictures show the same place at different points in the Southern Hemisphere’s spring. Landsat 8 collected the earlier observations on 14 September, and Landsat 9 acquired the October view on 24 October. A second comparison from farther southwest of the city shows a different sequence. White patches were prominent in September. By the October pass, much of that white had disappeared and purple-red flowering was more evident. Looking at both areas gives a better sense of how the season changed from valley to valley.
What the colours can tell us
From orbit, researchers can see the extent of a patch and compare it with earlier views. To identify the plants, they also need observations from the ground. Scientists cited by NASA associated the purple-red patches with plants in the genus Cistanthe, known locally as pata de guanaco. The white flowering in the second area was associated with Nolana. Those identifications involve field evidence and expert judgment. A colour alone would leave too many possible explanations, particularly where slopes include several kinds of ground cover.
There is a time gap in the evidence as well. Each picture records the land at the moment of a satellite pass. When a white patch is visible in the first picture and absent in the second, we know its appearance changed in the intervening weeks. The pair leaves open the exact day it changed. A fuller sequence of observations can help researchers estimate when a bloom began, when it spread and how long it remained visible.
Why a wet winter can matter months later
NASA’s account traces the spring display back to an unusually wet winter. It reports a series of storm fronts from mid-July and snow in parts of the desert in August, while El Niño was strengthening in the tropical Pacific. NASA’s El Niño overview explains how shifts in the ocean and atmosphere can influence weather well beyond the area where ocean temperatures first change. For the plants, the local question is how much moisture reached the soil and how long it stayed there. Rain can give dormant seeds a chance to germinate, and different patches of ground can respond at different times.
A single season is difficult to place in context without a consistent record. One study of historical desert flowering examined satellite vegetation records to compare events across decades. The 2026 scenes offer an addition to that kind of record. The researchers’ descriptions of the latest bloom are preliminary comparisons. A study using the same measurements across years would be needed to establish where it ranks for area, intensity or duration.
The October image accompanying this story is a Landsat observation of the same flowering area discussed above. Comparing it with NASA’s September image is a good way to see both the reach of the bloom and the limits of a snapshot. For another example of how scientists read images from space, see The Popular Story’s guide to the Roman telescope’s first images.
The images also give conservation staff a way to compare sites they cannot visit on the same day. A map can show where to spend limited time on the ground, while observations from those visits can help explain features that are ambiguous in the image.