Anyone in Delhi on the night of November 8 did not need a monitor to know the air was bad. Firecrackers went on well past midnight, and by the early hours the smoke had settled over the city like a lid. What the official numbers said about that night, though, depends on which website you checked.
A Hindustan Times analysis, reported by Business Today on Tuesday, found that 125 hourly PM2.5 readings from Delhi’s monitoring stations were missing from the Central Pollution Control Board’s (CPCB) records for the night. Every one of those missing readings was above 1,000 micrograms per cubic metre on the Delhi Pollution Control Committee’s (DPCC) own website.
What the DPCC data showed
The highest figure in the DPCC data was 3,744 µg/m³ at Mundka at 2 am on November 9. It was not alone. Several other stations crossed 2,500 in the hours after midnight:
- JNU: 3,023 µg/m³ at 4 am
- NSUT West Campus: 3,008 µg/m³ at 5 am
- Mandir Marg: 2,908 µg/m³ at 3 am
- Nehru Nagar: 2,808 µg/m³ at 3 am
- Wazirpur: 2,721 µg/m³ at 1 am
In all, eleven DPCC stations recorded levels above 2,000 at some point that night. For comparison, India’s national standard for PM2.5 averaged over 24 hours is 60 µg/m³.
The CPCB record told a flatter story. The highest reading it carried for the night was exactly 1,000. At 1 am, 36 of Delhi’s 59 stations had no PM2.5 reading at all in the central record. Where both sources did have a figure for the same station and hour, the numbers matched, which suggests the readings were taken but not passed on.
What officials have said
There has been no on-record statement from the CPCB. A government official, who was not named in the report, said the monitors were sending hourly data, that there were “some technical glitches,” and that all stations were reporting. As of the evening the report was filed, the missing readings had still not appeared in CPCB’s public records.
Does it change the AQI?
Less than you might expect, and that is part of the problem. The Air Quality Index tops out at 500. Once hourly PM2.5 goes past roughly 420 µg/m³, the index is already at its ceiling, so readings of 2,000 or 3,000 barely move it.
Even so, the gap is not zero. Using CPCB’s own method with the missing readings put back, the 24-hour AQI to 9 am on November 9 works out to about 384, against the 370 that CPCB published. For the 4 pm bulletin, the estimate is around 360 against a published 344. Both sit in the “very poor” band either way. But an index that hides the worst hours makes it harder for people, and for policymakers, to see how bad a single night really got.
How the season has gone so far
Delhi’s air had been sliding for over a week before Diwali. CPCB figures showed the city AQI at 117 on October 31, 261 on November 1 and 379 by the morning of November 4, with Jahangirpuri, Rohini and Punjabi Bagh crossing the 400 mark. The Commission for Air Quality Management blamed calm weather and north-westerly winds pushing pollutants into the National Capital Region. Stage II curbs under the Graded Response Action Plan, including stricter checks on vehicles entering the city, were already in place.
Forecasts from the IMD and IITM suggest the air will stay in the “very poor” range for the next few days.
Why this matters
Pollution data in India is public, and that openness is worth a lot. It only works if the record is complete. People decide whether to send children to school, whether to go for a morning walk, or whether an elderly parent should step outside, based on the numbers they see. If the worst hours quietly drop out of the official count, the picture people rely on is softer than reality.
For now, if you want the fullest view of your area, it is worth checking both the CPCB and DPCC dashboards rather than only one.
Reporting based on Business Today (citing Hindustan Times) and CPCB figures reported on November 4.
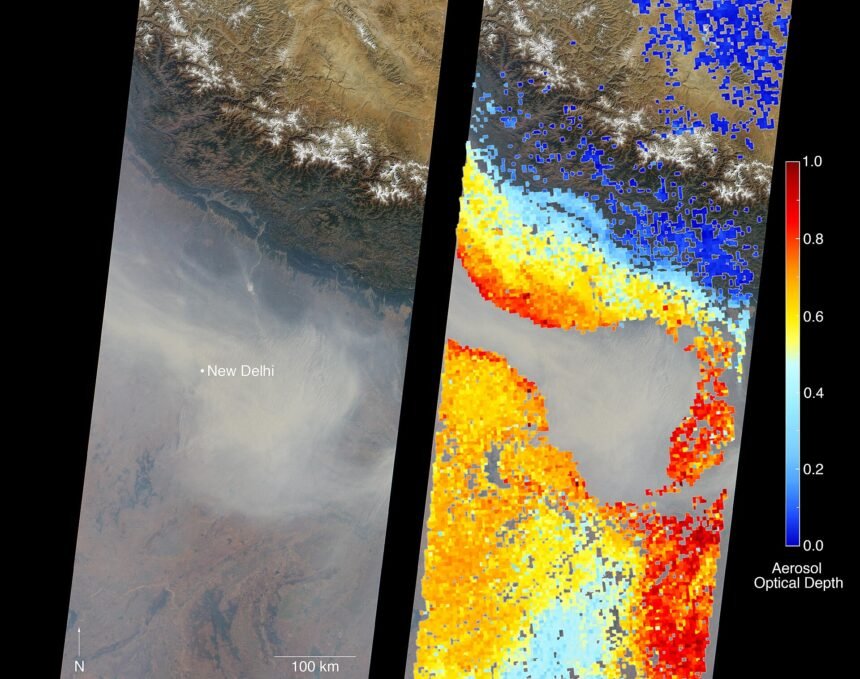
Featured image: Image: NASA/GSFC/LaRC/JPL, MISR Team, via Wikimedia Commons (Public domain).